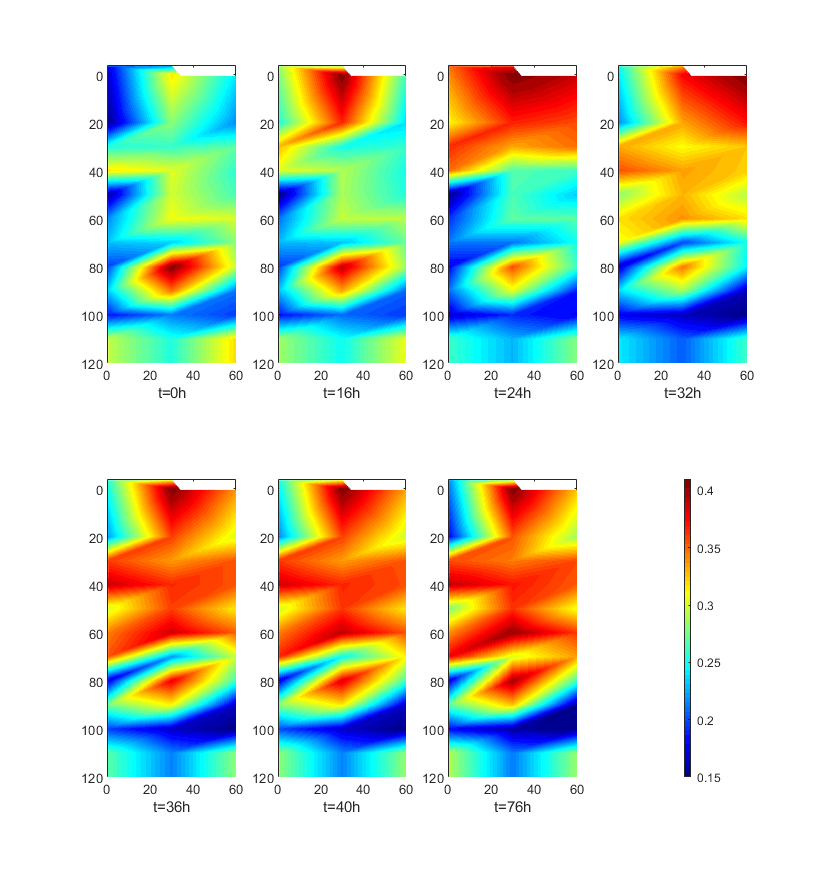
下面是一个画颜色图的例子:
%% 颜色图的绘制
figure(2)
j=0;
for i=[1 9 13 17 19 21 39]; % i 表示要打印图片的时间
discount=1.1; % 表层土壤含水率是10cm处的0.8倍,120cm处的按照100cm处的土壤含水率计算
columE1=[S5(i,1)*discount,S5(i,1:10),S5(i,10),S5(i,11)*discount,...
S5(i,11:20),S5(i,20),S5(i,21)*discount,S5(i,21:30),S5(i,30)]; % X1,Y1对应的观测值
X1=[ones(1,12).*60 ones(1,12).*0 ones(1,12).*30];
Y1=[-4,20:10:120,-4,20:10:120,0,20:10:120];
[xq,yq]=meshgrid(0:0.5:60,-4:0.5:120); % 要差值的空间
[x,y,z]=griddata(X1,Y1,columE1,xq,yq); % 插值
x_boundary=[0; 0; 30; 30+4; 60; 60]';
y_boundary=[120; -4; -4; 0; 0; 120]';
x_yanmo1=(121-1)/(60-0)*(x_boundary-0)+1;
y_yanmo1=(249-1)/(120-(-4))*(y_boundary-(-4))+1;
mask=poly2mask(x_yanmo1,y_yanmo1,249,121); %把边界外的转换成0
mask1=double(int16(mask)); % 转变成双精度数
mask1(mask1==0)=nan;
z1=z.*mask1;
j=j+1;
subplot(2,4,j)
pcolor(x,y,z1); % 伪色彩图
colormap('jet') % 设置色彩的style
% colorbar % 画出颜色条
% caxis([0.15 0.41]); % control colormap limits
axis([0,60,-4,120])
set(gca,'YDir','reverse');
shading interp
xlabel(['t=',num2str((i-1)*2),'h'])
end
subplot(2,4,8)
c = colorbar;
c.Ticks = [min(min(S5)) max(max(S5))];
colorbar('eastoutside')
caxis([0.15 0.41]); % control colormap limits
axis off